On this page
Palo Alto is one of the most expensive housing markets in the United States. That much is easy to say. Putting an accurate number on it is harder, because different sources measure different things over different periods. A median sale price from the multiple listing service, an owner estimate from the Census Bureau and an assessed value from the county can all describe the same street and disagree by millions of dollars.
This page gathers published figures, dates each one and explains what it measures. It is general information, not financial or investment advice. It makes no predictions. For a specific property, rely on recent comparable sales reviewed by a licensed agent or appraiser. If you are getting ready to bid, our guide to buying a home covers the process.
Where the numbers come from
Three kinds of data show up in news stories and listing flyers.
| Source | What it measures | Watch out for |
|---|---|---|
| MLSListings, the regional multiple listing service | Actual sale prices of homes listed through agents | Misses most off-market sales; neighborhood samples are small |
| Census Bureau American Community Survey | Owners' own estimates of value, averaged over five years | Values above $2 million are lumped into one top category |
| Santa Clara County Assessor | Assessed value for property tax | Proposition 13 keeps long-held homes far below market value |
Local news outlets, including The Almanac, Palo Alto Online and the Mountain View Voice, publish year-end summaries built on MLSListings data. Those are the most useful public figures for actual sale prices, so most of the numbers below come from them. The Census figure is better for comparing cities on a common basis. Assessed values tell you about tax bills, not prices. Our property taxes page explains why.
The citywide trend, 2023 to 2025
For single-family homes, The Almanac's year-end reports based on MLSListings data show steady gains.
| Year | Median single-family sale price | Reported |
|---|---|---|
| 2023 | $3.32 million | The Almanac, January 2025 |
| 2024 | $3.65 million, up nearly 10 percent | The Almanac, January 2025 |
| 2025 (Jan. 1 to Dec. 12) | $3.8 million, up about 5 percent | The Almanac, December 2025 |
The December 2025 report listed the 2024 figure as $3.63 million rather than $3.65 million, likely because it compared a slightly different window. Small differences like that are normal. Treat any single median as an approximate marker, not a precise price tag.
For context across the county, the Santa Clara County Association of Realtors reported that the county's median single-family price reached $2 million for the first time in April 2024, as ABC7 News reported at the time. Palo Alto's median runs well above the county figure.
What 2025 looked like
The Almanac's December 2025 report, covering January 1 to December 12, gave a fuller picture of the year:
- Sales. 407 single-family homes sold or went pending, up from 376 in 2024.
- Listings. 712 new listings, up from 630. Active listings of single-family homes and townhomes rose about 13 percent.
- High end. About 28 percent of single-family sales were at $5 million or more. Twenty-five sales, 6.4 percent of the total, were at $8 million or more.
- Cash. 35.1 percent of buyers paid all cash.
- Direction by neighborhood. Medians rose in 11 neighborhoods and fell in 2.
More inventory and more sales in the same year suggest that more owners chose to sell and buyers absorbed the supply. It does not tell you what any particular house is worth.
How neighborhoods differ
A rough split helps. North of Oregon Expressway, older neighborhoods have bigger lots, more pre-war houses and the highest prices. South Palo Alto has mostly postwar ranch homes and Eichlers on smaller lots. Prices there are lower but still far above national norms.
- Crescent Park had the highest median in 2024 at $5.1 million and was at about $6 million in 2025, according to The Almanac.
- Old Palo Alto was also at about $6 million in 2025.
- Green Acres shows how volatile small samples are. Its median was $4.87 million in 2024, second-highest in the city, then fell about 26 percent to $3.6 million in 2025.
- Downtown fell from $3.17 million in 2023 to $2.2 million in 2024, the sharpest drop that year, again on a small number of sales.
- Green Gables, an Eichler area in the MLS boundaries, recorded the most sales in 2025 with 49, about 12 percent of the city's total.
Neighborhood boundaries in these reports are the ones MLSListings uses, which do not always match the names residents use. Our south Palo Alto guide explains how the southern tracts fit together.
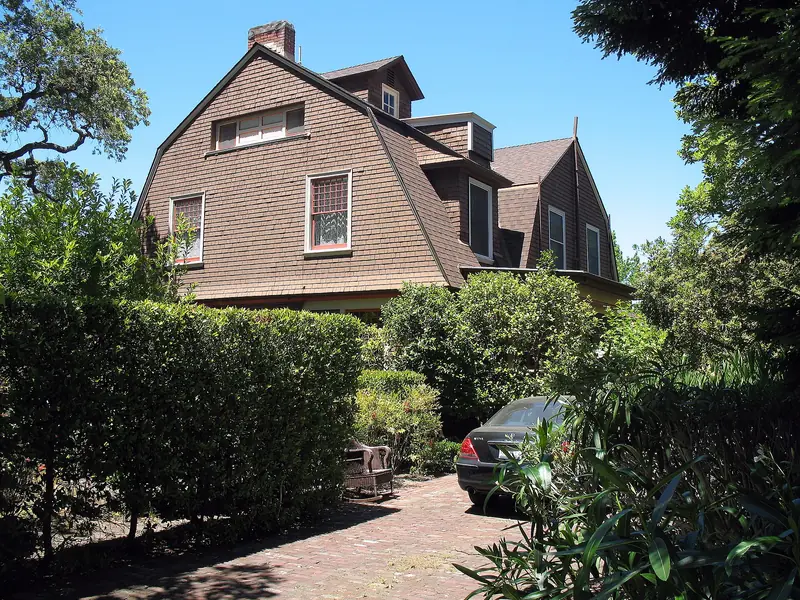

Condos and townhomes
Condos and townhomes are tracked separately from single-family homes and sell for much less. They are the main way buyers get into Palo Alto below single-family prices. Expect association dues on top of the mortgage and taxes. Read the association's finances closely. Because the number of condo sales in any one year is small, a published condo median can swing a lot. Our condo and townhome guide covers what to check.
How to read price reports
- Check the period. A year-to-date figure in December is not the same as a calendar year.
- Check the property type. Single-family, townhome and condo medians are very different.
- Mind the mix. If a few large estates sell in a quiet year, the median jumps even if no house gained value.
- Mind the sample. A neighborhood with ten sales can swing by a million dollars on one or two homes.
- List price is a strategy. With offer dates common here, some homes are listed below the price the seller expects. Compare sale prices, not asking prices.
What drives prices here
Several long-running factors explain why Palo Alto prices sit where they do. Land is the biggest one. Lots are limited, the city is built out and in many cases the land is worth more than the house on it. Schools matter to many buyers. Palo Alto Unified is a major draw. Stanford, the hospitals and a dense job base sit inside or next to the city, which keeps demand steady. Supply grows slowly because most residential land is zoned for single-family homes, though accessory dwelling units and new multifamily projects are adding some.
Policy matters too. State laws on accessory dwelling units and lot splits, covered in our ADU guide, let owners add homes on existing lots, which can raise what a large lot is worth to the right buyer. Historic rules and single-story overlay zones work the other way on some streets by limiting what can be built. Two similar houses can therefore sell for different prices because of what the zoning allows.
Interest rates and stock market swings also affect what buyers can pay, especially at the high end where equity compensation is common. None of that predicts next year. For renters weighing whether to buy, our renting guide covers the other side of the market. The Census Bureau's 2020 to 2024 survey put the median gross rent at $3,484 a month, a figure that includes long-term tenants.
Good to know
- MLS medians describe homes that sold, not all homes.
- Census values above $2 million are top-coded, so the true median is higher.
- Assessed values often trail market value by a wide margin because of Proposition 13.
- For a specific address, ask a licensed agent or appraiser for recent comparable sales.
Frequently asked questions
What is the median home price in Palo Alto?
The Almanac, using MLSListings data, reported a median single-family sale price of $3.8 million for January 1 to December 12, 2025. That was up from about $3.65 million in 2024 and $3.32 million in 2023. Condos and townhomes sell for less and are tracked separately.
Which Palo Alto neighborhoods are the most expensive?
North Palo Alto neighborhoods with large older lots usually top the list. In MLSListings data reported by The Almanac, Crescent Park had the highest median in 2024 at $5.1 million. Both Crescent Park and Old Palo Alto were at about $6 million in 2025.
Why does the Census say Palo Alto's median home value is $2 million?
The Census Bureau's American Community Survey caps reported home values at its top category, which is above $2 million. Its figure is an owner estimate averaged over five years, not a sale price. The true median value is higher than the cap.
How many Palo Alto buyers pay cash?
The Almanac reported that 35.1 percent of single-family buyers in Palo Alto paid all cash in 2025, based on MLSListings data. Cash offers can close quickly and skip loan and appraisal contingencies, which sellers often value.
Will Palo Alto home prices go up or down?
This guide does not forecast prices. Published medians have risen in recent years, but small sample sizes, interest rates and the mix of homes sold all move the numbers. Look at recent comparable sales for a specific address with a licensed agent or appraiser.